Back in our FOSDEM 2023 takeaway, we wrote this:
We’ve run a quick experiment on multicore encoding using the new support from OCaml 5 and it was pretty amazing! I was able to encode 10 concurrent
1080pvideos on my M1 pro, watching the CPU cores getting loaded up! Unfortunately, though, there are some important pending changes in the code to make this suitable for production releases.
Those pending changes took a bit longer than the one release cycle we were hoping for. But they are done! On main, scheduled for release as 2.5.0, liquidsoap runs on OCaml 5. Its scheduler runs on a pool of domains. And the FFmpeg bindings finally use all the cores you paid for.
This post comes in two parts. First, what we changed and why: callbacks that can now be taken back off a source, the scheduler, and the FFmpeg bindings. Then, measurements. We wanted to know what all this does to a genuinely demanding script, what the extra concurrency costs in CPU and memory, and how to tune it for your own scripts.
- Why OCaml 5, finally
- Callbacks that can be removed
- Duppy goes multicore
- From select to epoll
- FFmpeg, the last mile
- Let’s measure this!
- Now for FFmpeg
- How we measured
- Results
- So why is burning more CPU an improvement?
- Several streams at once
- Conclusion
Why OCaml 5, finally
We tried this before! Liquidsoap briefly required OCaml 5.1 in February 2024, and three months later it went back to 4.14. We were already using effect handlers back then, for collecting work after a script evaluation, and all of it came out in the revert.
What held us back was the garbage collector. It had trouble keeping its collecting pace on our workloads, and we could not get back to the runtime performance we had on the 4.x series.
We reported it as ocaml/ocaml#12228 and wrote it up in our memory management post. That is what we meant, back in 2023, by “We’re not ready for ocaml 5 yet.”
And what a lot of work it was upstream. Multicore OCaml took years of relentless effort from the OCaml maintainers, and the result is a genuinely remarkable piece of engineering. If you want the story, The Saga of Multicore OCaml is well worth your time. Everything in this post is built on top of that, and we’re very grateful for it.
What made it stick for us this time was a memory leak.
Callbacks that can be removed
Liquidsoap sources emit events and scripts attach callbacks to them: on_metadata, on_track, on_position, on_frame. Until recently, registering a callback was a one-way street. You could add one to a source, and that was it. There was no way to take it back off.
That is fine when registration happens once, at startup. It is much less fine when it happens over and over.
Several of our operators call a function you wrote, over and over, by design. switch, fallback and rotate call on_select on every selection. cross calls its transition on every track change.
That is fine until the function registers on a source it was handed, because the registration outlives the call and the next one adds another. A transition building fades on its sources was the case we chased, and it is a scripting problem rather than a fades problem. Any function that registers on a source it is given behaves the same way.
The symptom is why it went unnoticed for so long. It surfaces as CPU creeping upward rather than memory growing, because a major collection costs what it has to walk. If you watch a memory graph you never see it. #5338 and #5357 have the measurements and the two cases we found.
The fix has to say something precise: undo the registrations that this call made, on these sources, and nothing else. The hard part is where those registrations happen. They’re arbitrarily deep inside the user’s script, through the language interpreter, through other operators. We cannot thread a collection parameter through all that, and most of it is code you wrote rather than us.
OCaml effect handlers gave us a way in, though not one they are usually reached for. Registering performs an effect carrying the function that would release it:
type _ Effect.t +=
  | Registered : { owner : int; release : unit -> unit } -> unit Effect.t
An operator about to hand its sources to a script function wraps the call in a handler. Every registration inside gets caught, at any depth, through any amount of script. Its release is stashed away and the computation carries on where it was:
| Registered { owner; release } when List.mem owner owners ->
    Some (fun k ->
      releases := release :: !releases;
      Effect.Deep.continue k ())
When the call returns, the operator holds one release. It undoes exactly what that call registered on its own sources. The script does not change, the layers between do not change, and the bookkeeping lives in one handler.
The trick is that effect handling is not local. The registrations happen deep inside that function, and the handler collecting the cleanups sits far outside it. Nothing in between has to know any of this is going on, and neither does your script.
Here is script code of the kind that runs inside such a call. The registering is done by a helper, one level down from the function the operator actually calls. The comments mark where liquidsoap picks up the way out:
def log_events(s) =
  # effect collect cleanup callback here
  s.on_metadata(synchronous=false, fun (_) -> log("new metadata"))

  # effect collect cleanup callback here
  s.on_position(position=30., synchronous=false, fun (_, _) -> log("at 30s"))
end

def setup(s) =
  # effect collect cleanup callback here
  s.on_track(synchronous=false, fun (_) -> log("new track"))

  log_events(s)
  s
end

s = sine()

# Runs setup and hands back one release covering every registration above.
c = source.collect_callback_releases([s], fun () -> setup(s))

# Later, undo all three at once.
c.release()
The handler catches all three the same way. Depth costs it nothing.
Collecting releases is available to your own scripts too. source.collect_callback_releases takes the sources you care about and a function to run, and gives you back the function’s result along with a single release. It is worth reaching for whenever you call something more than once with the same sources, because the callbacks it registers on them live as long as those sources do.
Clocks get the same treatment. We keep track of them as operators, sources and outputs get created, and start them once everything is ready.
Duppy goes multicore
With OCaml 5 in place, it was time to make the scheduler take advantage of it.
Duppy is our task scheduler. It takes care of request resolution, harbor clients, thread.run handlers, the telnet server, and generally everything that has to happen off the streaming path.
Historically, a duppy computation that needed to wait on a socket had to be written as a chain of tasks, each one returning the next. That’s continuation-passing style, written out by hand. There was simply no other way to suspend a computation in the middle and pick it up later.
Effect handlers give us one.
type _ Effect.t += Await : suspension -> event list Effect.t
Parking registers an ordinary task whose handler resumes the computation where it left off. The task type doesn’t change, tasks that never park cost nothing extra, and a computation can park as many times as it needs to.
The whole monadic API went away with it. Harbor and the server got rewritten in direct style, and both got shorter in the process.
With computations no longer chopped into task chains, we could finally parallelize the scheduler itself (#5359). Duppy now runs on a pool of OCaml 5 domains. There’s one Domain.recommended_domain_count () worth of them for dispatching, plus one more running the event loop. That replaces a fixed set of system threads all fighting over the same runtime lock.
settings.scheduler.legacy := true and you get the old, sequential behavior back. Please file a ticket if you need it.
Tasks now come in two flavors. Immediate tasks never block, so all the ready ones are taken as a batch and run in sequence directly on a domain. Blocking tasks may park in a syscall, so each one runs on an auxiliary thread inside its domain. Parking then releases the runtime lock, and the domain goes straight back to dispatching.
settings.scheduler.blocking_tasks caps how many Blocking tasks can be in flight at once. It defaults to one per domain, never fewer than five in total, so a small machine still gets a handful.
The dispatcher alternates between Immediate and Blocking work, so a steady stream of immediate tasks cannot starve the blocking ones.
From select to epoll
While we were reworking duppy, we took the opportunity to deal with something else: the scheduler’s own work was growing with the number of file descriptors it tracked, whether or not anything was happening on them.
select and poll, which duppy used up to that point, have no memory of what you asked them last time. On every pass through the loop you hand the kernel the complete set of descriptors you care about, and it hands the same set back with the ready ones marked.
That leaves two jobs on our side. First we walk the entire set to find which descriptors fired, because the answer is spread across all of them. Then, for each one that did, we work out which task was waiting on it.
The kernel only ever talks about descriptors. It knows nothing about the computation parked on the other end, so matching a ready descriptor back to its handler is entirely our problem.
select, on every single pass

  we hand over  [3][7][12][19][23] ... [900]   the whole set, rebuilt each time
  kernel scans  every one of them
  we walk       [ ][ ][R][  ][  ] ... [   ]    to find the ready ones
  we search      12 -> which task wanted 12?   a scan through the tasks
select is now gone, replaced by epoll on Linux and kqueue on BSD. They hold the registration in the kernel instead. You register a descriptor once and it stays registered, and a wait hands back only the events that actually fired.
epoll, once

  we register   [3][7][12][19][23] ... [900]   the kernel keeps the set

epoll, on every pass

  kernel hands  [12 readable]                  only what actually fired
  we look up     12 -> task                    one hit in a table
The kernel returns only the descriptors that fired, and only the events they fired on, so the first job disappears. Matching each descriptor back to its task is the job we had to build ourselves.
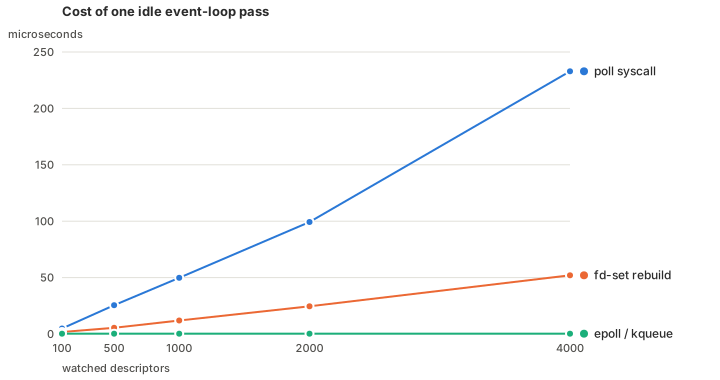
Here is what one event-loop pass costs, with N sockets registered and nothing happening on any of them, which is what an idle scheduler does all day:
| watched descriptors | poll syscall |
epoll / kqueue |
duppy's own fd-set rebuild |
|---|---|---|---|
| 100 | 4.9 µs | 0.3 µs | 1.8 µs |
| 500 | 25.5 µs | 0.3 µs | 5.5 µs |
| 1000 | 49.8 µs | 0.3 µs | 12.0 µs |
| 2000 | 99.3 µs | 0.3 µs | 24.6 µs |
| 4000 | 232.9 µs | 0.3 µs | 52.0 µs |
The epoll cost does not move. A wait costs what is ready, not what is watched. The other two grow with every connection, and both were paid on every pass.
Our own side matches now: a ready descriptor finds its tasks in a single lookup, whatever the number of connections. Platforms with neither mechanism still fall back to select.
FFmpeg, the last mile
The heaviest work in the process still went through one thread. For a 4K video stream the dominant costs are decoding the background video, scaling it, and encoding the result, and all three live in the FFmpeg bindings.
They were almost entirely single-threaded, and had been for years. The reason is easy to overlook. libavcodec gives a codec context exactly one thread unless you ask for more. Every liquidsoap decoder, and every encoder except one, was running on that single thread.
The exception was libx264, which picks a thread count of its own when the caller does not ask for one. So an H.264 encode was already spreading across cores while everything around it stayed on a single thread. The decoders, the scaler and every other encoder included. The test below encodes with libx264, which is why our baseline is not completely serial to begin with.
FFmpeg’s own command-line tools raise the count to automatic before opening a codec. So #5388 does the same, from the single place where every codec is now opened:
/* libavcodec runs a codec on a single thread unless told otherwise, ffmpeg's
   own tools raise that to automatic before opening one: do the same. */
codec_context->thread_count = 0;
This only sets the starting point, so an explicit threads on an %ffmpeg encoder still overrides it if you want the old behavior back.
Threading the encoder by default is worth a lot on its own. An %ffmpeg output using libx265 on a 4K input is about 2.5 times faster.
Scaling is threaded too now. settings.ffmpeg.scaling_threads sets the count, defaulting to 1, which scales on the calling thread.
That default comes out of the measurements further down, where auto-threading the scaler showed no benefit at any resolution we tried. Set it to 0 for one thread per core if your workload disagrees.
Let’s measure this!
Time to find out what all of it is worth. We start with the scheduler, where the question is what OCaml’s multicore domains actually deliver for the work liquidsoap does off the streaming path. We are a particular case there.
A lot of that work is network I/O, where a task spends its time waiting and holds no core at all.
A lot of the rest is media decoding, which blocks just the same but burns a core the whole time it does. Waiting work and computing work turn out to want opposite things from a scheduler, and the numbers below say so quite clearly.
Then we turn to FFmpeg and measure what its threading support gives us on a video stream.
Serving HTTP
The harbor answering HTTP requests is the clearest case. The script registers one endpoint returning a fixed payload, and a load generator drives it at a rising number of simultaneous clients.
The test script
payload = string.make(char_code=120, 1024)

harbor.http.register.simple(
  port=8123,
  method="GET",
  "/static",
  fun (_) -> http.response(status_code=200, content_type="text/plain", data=payload)
)

output.dummy(fallible=true, blank())
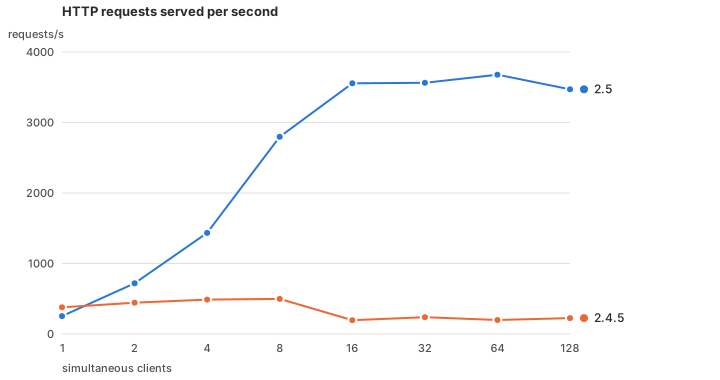
Requests served per second, and the median time to answer one, as the number of simultaneous clients rises:
| clients | 2.4.5 req/s | 2.5 req/s | 2.4.5 median | 2.5 median |
|---|---|---|---|---|
| 1 | 379 | 253 | 2 ms | 4 ms |
| 8 | 497 | 2798 | 16 ms | 2 ms |
| 32 | 238 | 3563 | 160 ms | 8 ms |
| 128 | 225 | 3471 | 601 ms | 36 ms |
The old scheduler tops out around 500 requests per second, then goes backwards. Past eight clients it serves fewer requests than it did at eight, and the median climbs past half a second. It never uses more than one core, because that is all a set of system threads sharing a runtime lock can use.
The new one holds around 3500 requests per second from sixteen clients to a hundred and twenty eight. It answers in 36 ms where the old one took 601. At one client it is slightly slower, which is the pool’s fixed cost showing up with nothing to spread.
This is the shape we expected and it bodes well for the places it has not been measured yet.
output.harbor runs on the same machinery, and so does the new icecast we have been building. We want a full iteration on that before putting numbers on it, and we are looking forward to seeing what it can do.
Resolving playlists
A script with a lot of playlists takes a long time to start, and the clock complains while it does. This test is modelled on some of the more extreme scripts we have seen from users in the wild.
Every playlist resolves a request before it can play. That means running the protocol, reading metadata, and opening the file to see whether it can be decoded at all. That work happens off the streaming path, which makes it exactly the kind of thing the scheduler is supposed to spread out.
The test script
n = 640

sources =
  list.map(
    fun (_) -> playlist("/path/to/audio", prefetch=3, reload_mode="rounds", reload=1),
    list.init(n, fun (i) -> i)
  )

output.file(%mp3(bitrate = 128), fallible=true, "/dev/null", fallback(sources))
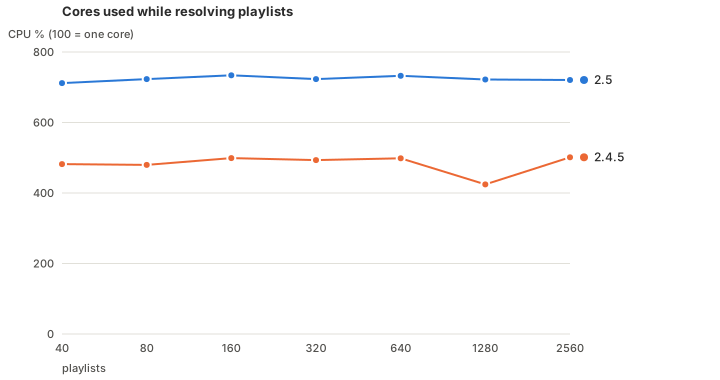
Time from launch until the machine goes quiet, which is when every playlist has a track ready:
| playlists | 2.4.5 | 2.5 | 2.4.5 peak CPU | 2.5 peak CPU |
|---|---|---|---|---|
| 40 | 1.0 s | 3.5 s | 482% | 712% |
| 80 | 2.6 s | 3.6 s | 480% | 723% |
| 160 | 3.9 s | 4.3 s | 499% | 734% |
| 320 | 7.5 s | 5.7 s | 493% | 723% |
| 640 | 12.3 s | 8.6 s | 498% | 733% |
| 1280 | 37.3 s | 16.9 s | 424% | 722% |
| 2560 | did not settle within 90 s | 43.3 s | 501% | 720% |
CPU is measured while requests are resolving, and 100% means one core.
Under a couple of hundred playlists there is nothing in it. The gain arrives as the script grows. By 1280 playlists 2.5 is twice as fast.
The gain is real and moderate, nowhere near the fifteen times the harbor gave us.
A blocking task is blocking. Opening a file to identify it has no seams to divide along, so all a scheduler can do is run more of them at once.
And 2.4.5 was never confined to one core here anyway. The expensive part runs inside FFmpeg, and our bindings release the runtime lock before calling in, so five threads probing five files genuinely ran at the same time. That is the 480% to 501% it holds at every size. Domains lift it to around 730%.
Now for FFmpeg
The test is a plain transcode: one video file in, one HLS stream out. The pipeline is decode, then encode, and nothing else. Source and output share a resolution, so no scaling happens between them.
Three things vary.
The resolution. The same source, rendered ahead of time at every step of a ladder from 720p to 8K.
The encoder thread count. libx264 picks its own when you let it, which is min(cores + 1, 16). We ran it at that default and at fixed counts down to one.
The scaler thread count, through settings.ffmpeg.scaling_threads, set independently of the encoder.
How we measured
Everything ran on the same machine, an Apple M1 MacBook Air from 2020 with 16 GB of RAM, on Asahi Linux. Its eight cores are not equal, which matters later: four efficiency cores at 2.06 GHz with a capacity rating of 493, and four performance cores at 2.99 GHz rated 1024.
Liquidsoap runs a streaming loop. Each pass produces a frame of audio and video, and it has to produce it faster than the duration that frame represents. Fall behind and the clock says so, reporting how far, and that lag accumulates while the problem lasts. Ending near zero means the loop kept up. Climbing without bound means it did not. That is the verdict column.
A frame lasts 20 ms here, since settings.frame.duration is 0.02. The clock hands the pipeline a frame, waits for it to come back, then sleeps until the next one is due. Duty is how much of that window the work took:
                        |<------------ 20 ms ------------>|

encoder auto,  30% duty |######...........................|
   encoder 1,  66% duty |##############...................|
 over budget, 100% duty |#################################|

                         # working    . clock waiting
At 30% the pipeline finishes in 6 ms and the clock waits 14. At 66% it finishes in 13 and waits 7. At 100% there is no waiting left, so the next frame that costs anything at all arrives late and the lag starts to accumulate.
A throughput benchmark runs flat out and reports how fast it went. A live stream cannot go fast. It produces exactly one second of output per second, so a faster pipeline yields more idle time and the same output. Measuring speed therefore reports nothing. Duty measures the headroom, which is the quantity that actually changes.
Memory comes from runtime.memory() inside the script, which reports the process’s private footprint rather than resident size. Liquidsoap allocates in two places, the OCaml heap and FFmpeg’s buffers on the C side, and only the first is visible to the garbage collector. Logging the heap alongside the total says which of them is growing.
The test script
# Output size, and the source rendered at that same size so nothing scales.
w = 3840
h = 2160

video.frame.width := w
video.frame.height := h
settings.ffmpeg.scaling_threads := 1

s = mksafe(single("media/#{w}x#{h}.mkv"))

enc =
  %ffmpeg(
    format = "mpegts",
    %audio(codec = "aac", b = "192k"),
    %video(codec = "libx264", preset = "ultrafast", g = 50, threads = 0)
  )

o = output.file.hls(segment_duration=2., "hls", [("radio", enc)], s)

# Private memory excludes shared pages, and the OCaml heap separates runtime
# growth from the buffers FFmpeg allocates on the C side.
thread.run(
  every=5.,
  fun () ->
    begin
      m = runtime.memory()
      word = runtime.sys.word_size / 8
      log.important(
        label="mem",
        "private=#{m.process_private_memory} \
         heap=#{runtime.gc.quick_stat().heap_words * word}"
      )
    end
)

work = ref(0.)
idle = ref(0.)
count = ref(0)
began = ref(0.)
ended = ref(0.)

o.on_output(
  before=true,
  synchronous=true,
  fun () ->
    begin
      now = time.up()
      if ended() > 0. then idle := idle() + now - ended() end
      began := now
    end
)

o.on_output(
  before=false,
  synchronous=true,
  fun () ->
    begin
      now = time.up()
      work := work() + now - began()
      ended := now
      count := count() + 1
      if
        count() >= 500
      then
        log.important(label="duty", "work=#{work()} idle=#{idle()}")
        count := 0
        work := 0.
        idle := 0.
      end
    end
)
Results
Scaler threads
Two things can be threaded here, the encoder and the scaler, so we took the scaler first. Splitting frames across cores in the scaler helped nowhere we measured:
| duty, lower is better | scaler 1 | scaler auto |
|---|---|---|
| encoder 1 | 66% | 75% |
| encoder auto | 30% | 34% |
Duty is worse with the scaler threaded in both cases, by 9 points when the encoder is capped and 4 when it is not, and CPU is slightly higher too. Splitting a frame costs a fan-out and a join, and a stream held to real time pays that on every frame rather than amortising it over a long run.
That is one workload on one machine, and our transcode never scales anything, so what this exercises is the colour conversion rather than a real resize. libswscale is also being actively reworked upstream, with several hundred commits in the last year including new threading helpers. We changed our default to one thread because that is what our measurements supported.
So every measurement below caps the scaler at one thread, and only the encoder count varies.
Encoder threads at 4K
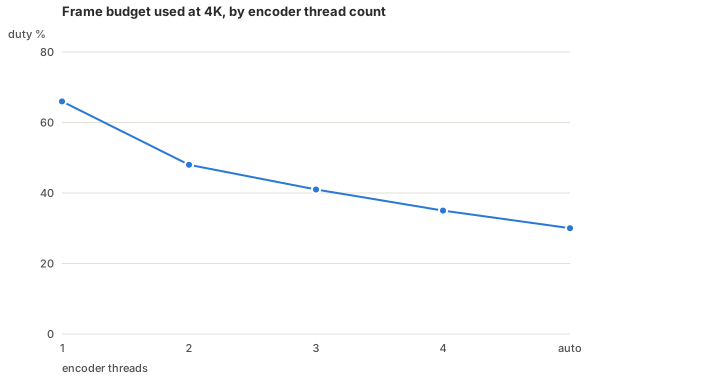
With the scaler pinned at one thread, the only thing left to vary is the encoder. We ran the same 3840x2160 transcode at one, two, three and four threads and at automatic, to find out what each extra thread costs in CPU and what it returns in headroom.
Duty is the share of each frame’s duration spent producing it. The last column is CPU divided by duty, which is the average number of cores busy while the pipeline works.
| encoder threads | duty | CPU | cores in use | private memory |
|---|---|---|---|---|
| 1 | 66% | 148% | 2.2 | 3349 MB |
| 2 | 48% | 198% | 4.1 | 2978 MB |
| 3 | 41% | 211% | 5.1 | 3373 MB |
| 4 | 35% | 219% | 6.3 | 3140 MB |
| auto (9) | 30% | 228% | 7.6 | 3650 MB |
Threading the encoder converts work into cores. One thread runs the pipeline on two cores and needs two thirds of each frame. Auto spreads it over seven and a half and needs under a third. The CPU column is the price: 148% becomes 228% for the same output stream.
The returns fall off quickly. Going from one thread to two buys 18 points of duty. Two to four buys 13. Four to auto buys 5.
Memory barely moves. The spread across every setting is 3.0 to 3.7 GB, and memory does not track the thread count in either direction. Whatever the encoder’s worker threads cost in buffers, it is small next to what the pipeline holds anyway.
Where the work lands
The machine has four efficiency cores and four performance cores, and the scheduler places threads by size: a thread small enough to fit an efficiency core is cheaper to run there.
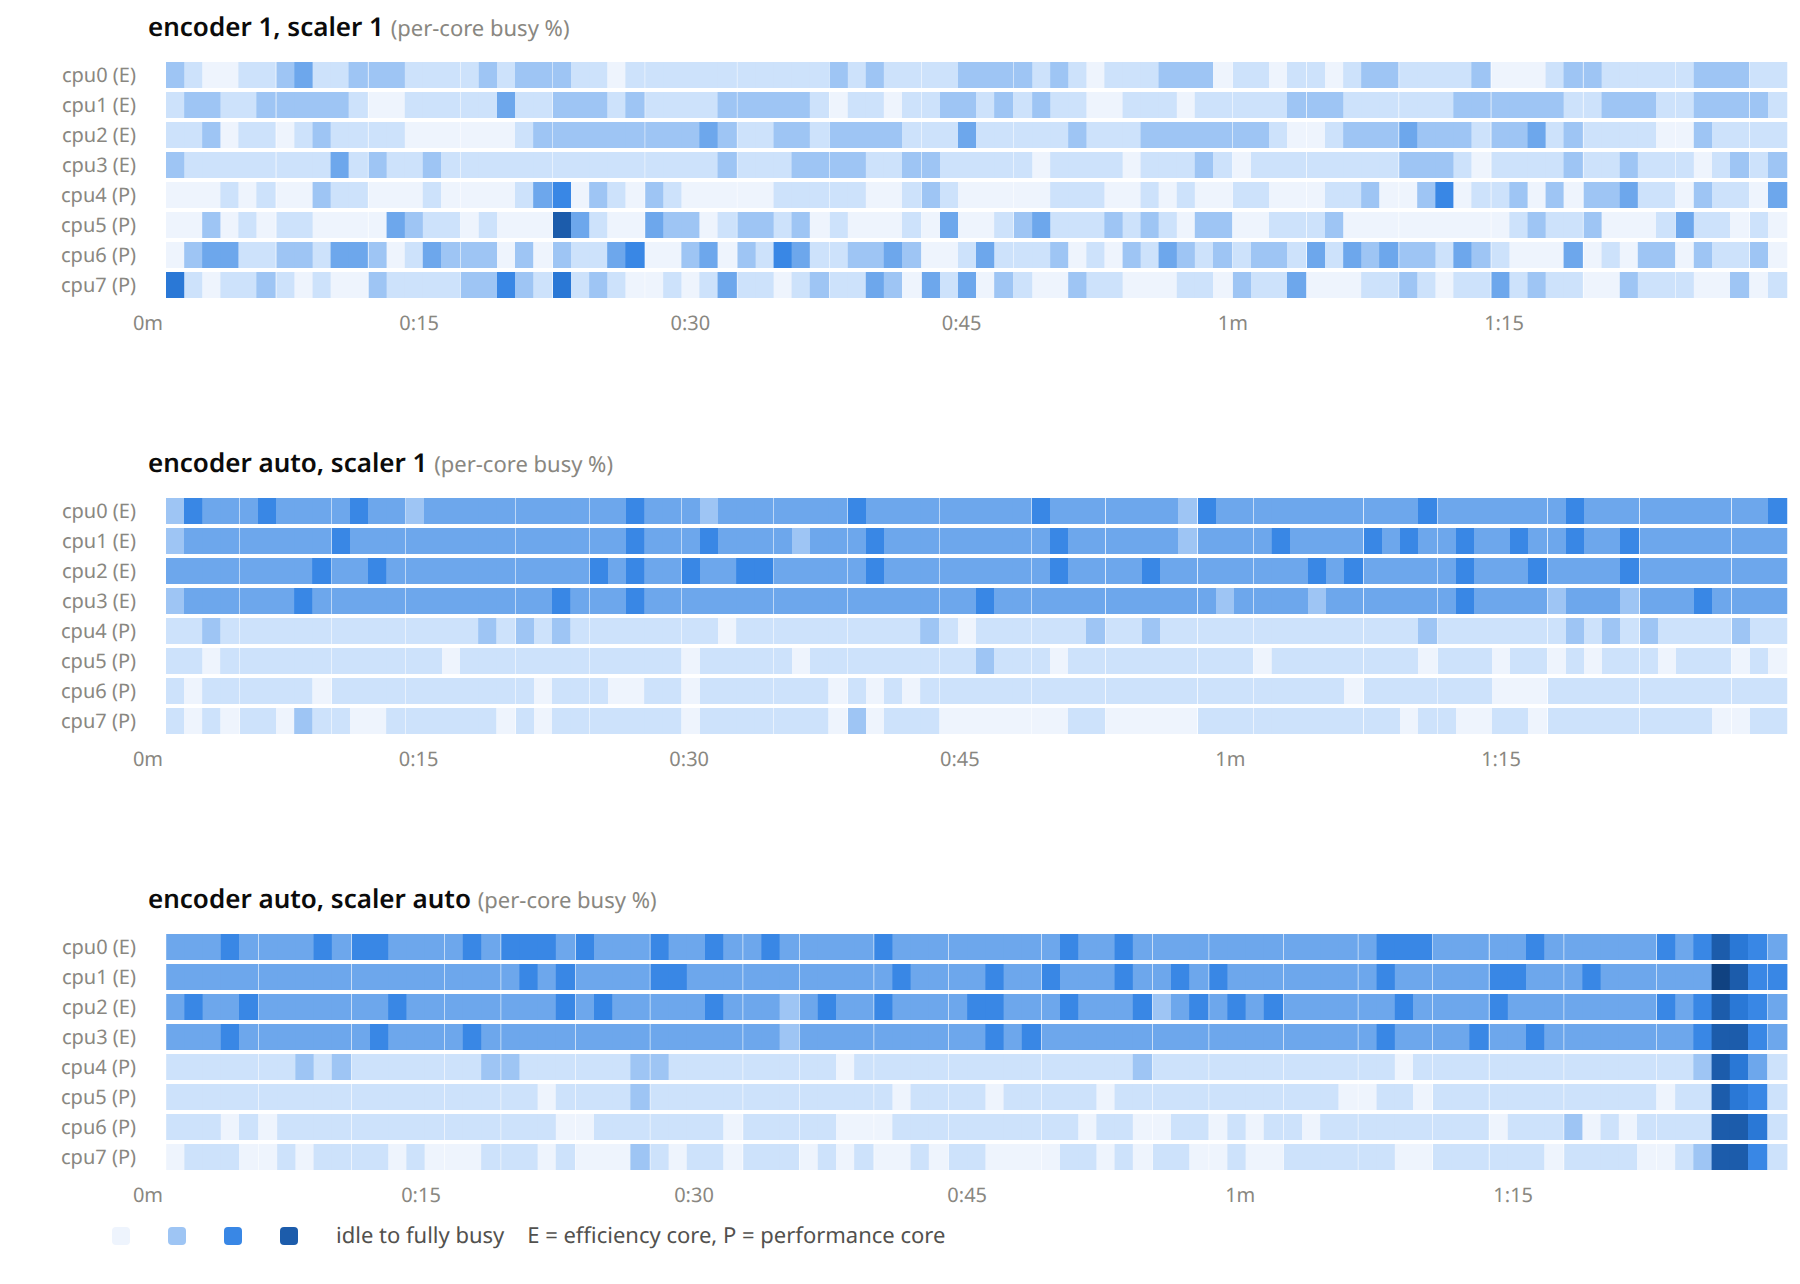
| efficiency cores | performance cores | |
|---|---|---|
| encoder 1, scaler 1 | 22, 24, 23, 21 | 16, 17, 25, 20 |
| encoder auto, scaler 1 | 44, 45, 45, 44 | 21, 17, 16, 14 |
| encoder auto, scaler auto | 48, 47, 47, 46 | 21, 18, 18, 16 |
With one encoder thread nothing is saturated and the load is scattered thinly over all eight cores. Threading the encoder doubles the efficiency cores, from about 22% to 45%, while the performance cores stay where they are. x264’s workers are each small enough to land on an efficiency core, so that is where they go.
The ceiling is also not where we assumed. Even at auto the efficiency cluster is under half busy, so the cores are not what runs out.
Scaling up
With encoder threads on automatic and the scaler capped at one, we ran the same transcode at every step of the ladder:
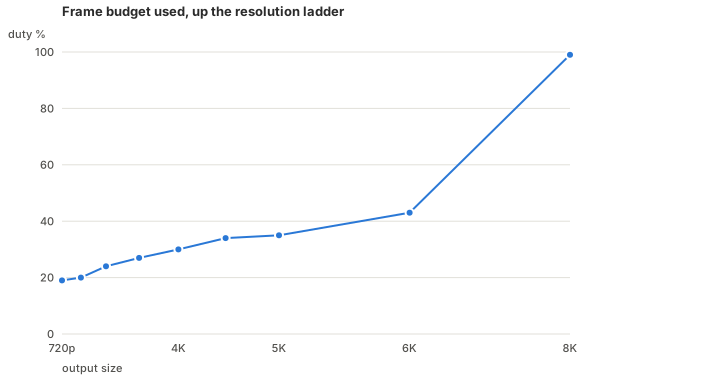
| resolution | megapixels | duty | CPU | cores in use | private memory |
|---|---|---|---|---|---|
| 1280x720 | 0.9 | 19% | 66% | 3.5 | 817 MB |
| 1920x1080 | 2.1 | 20% | 91% | 4.6 | 1345 MB |
| 2560x1440 | 3.7 | 24% | 133% | 5.5 | 1860 MB |
| 3200x1800 | 5.8 | 27% | 184% | 6.8 | 2800 MB |
| 3840x2160 | 8.3 | 30% | 229% | 7.6 | 3651 MB |
| 4480x2520 | 11.3 | 34% | 268% | 7.9 | 4461 MB |
| 5120x2880 | 14.7 | 35% | 297% | 8.5 | 5980 MB |
| 6400x3600 | 23.0 | 43% | 375% | 8.7 | 7733 MB |
| 7680x4320 | 33.2 | 99% | 752% | 7.6 | 10268 MB |
Every step up to 6400x3600 held real time. 8K did not, finishing 18.98 s behind.
Pixels rise 25 times from 720p to 6400x3600, and duty only goes from 19% to 43%. The pipeline absorbs the extra work by recruiting cores rather than by eating into its headroom. Cores in use climbs at every step, from 3.5 to 8.7, so the eight cores are fully occupied by the top of the ladder. Memory grows linearly with pixel count, at roughly 300 MB per megapixel above a fixed base.
8K breaks the pattern on every axis at once. Duty more than doubles, 43% to 99%, and so does CPU, 375% to 752%. That run needed 10.3 GB on a 16 GB machine and was swapping. It is a memory result rather than a clean compute measurement. Where the compute ceiling sits above 6400x3600 is something this machine cannot tell us.
So why is burning more CPU an improvement?
What it buys is headroom. A single encoder thread produces the same HLS stream for 148% CPU where auto spends 228%. On a workload that already fits, that extra CPU goes nowhere you can see.
What it changes is what the loop does with the rest of each frame. At 4K it sits idle for 70% of every frame with the encoder threaded, against 34% on a single thread. That idle time is the headroom.
That headroom pays off when something goes wrong, or when you ask the pipeline for more than it is currently doing.
Headroom absorbs whatever else the machine throws at you. A backup kicking off, a log rotation, a network hiccup that stalls a write, a garbage collection that runs long, another station on the same box hitting a busy stretch. A pipeline at 30% duty shrugs all of that off. One at 90% turns them into a catchup warning and a gap your listeners hear.
It also sets how far you can push the stream itself. One thread runs out at 4480x2520, auto at 6400x3600. The extra CPU is what pays for the difference, and on a machine with idle cores it is spending something you had no other use for.
The rest of this post runs several streams side by side, in a few different arrangements, to see how these considerations hold up once the cores are no longer idle.
Several streams at once
The workload is N independent transcodes on one machine. Each stream decodes its own file and encodes to /dev/null, so nothing touches the disk. For each resolution we raise the stream count until the clock stops keeping up, and the last count that held is the answer.
We tried three arrangements: every stream on one clock, a clock each, and a process each.
The test script
n = 8

enc =
  %ffmpeg(
    format = "mpegts",
    %audio(codec = "aac", b = "192k"),
    %video(codec = "libx264", preset = "ultrafast", g = 50, threads = 1)
  )

sources = list.map(fun (_) -> mksafe(single("input.mkv")), list.init(n, fun (i) -> i))

# Without this, each stream ends up on a clock of its own.
clock.assign_new(id="shared", sources)

list.iter(fun (s) -> output.file(fallible=true, enc, "/dev/null", s), sources)
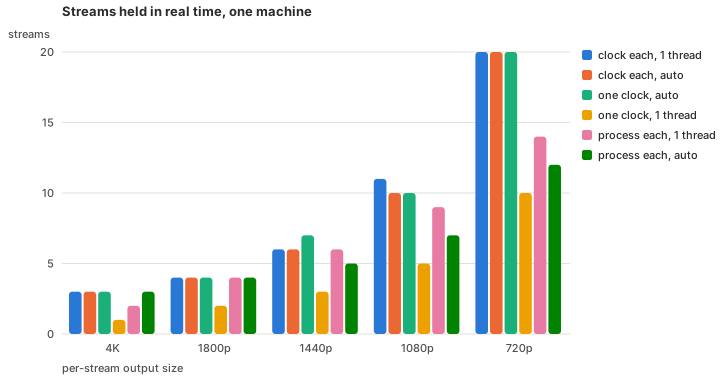
| 1280x720 | streams | CPU | memory | threads |
|---|---|---|---|---|
| one clock, 1 thread | 10 | 250% | 1.1 GB | 357 |
| one clock, auto | 20 | 641% | 3.0 GB | 987 |
| clock each, 1 thread | 20 | 454% | 2.0 GB | 708 |
| process each, 1 thread | 14 | 364% | 9.2 GB | 866 |
Parallel clocks buy most of what parallel encoding buys, and more cheaply: twenty streams at 720p either way, on 454% CPU against 641%. Once the clocks are separate, turning encoder threads up stops adding streams.
Running one process per stream spreads across cores too, with a lower ceiling. Fourteen streams at 720p against twenty, on 9.2 GB against 2.0, because every process carries its own runtime and caches.
That is a more modest result than we were hoping for. The headroom is not what fits more streams on a box, since the clock arrangement does that better. It is there for the moments when liquidsoap competes with everything else the machine is doing.
Conclusion
The thread running through all of this is that concurrency only helps where the work can actually run at the same time, and what decides that is the shape of your workload.
Two questions get you most of the way. Does this work spend its time waiting, or using a core? And is it stuck behind a single thread that has to do it all in order?
For the scheduler, the question is waiting against computing. Work that genuinely waits parallelises enormously. Harbor clients, HTTP requests, a mount that is slow to answer. That is where the fifteenfold numbers come from, and you do not have to do anything to get them.
Work that blocks while still burning a core is different. Opening a media file to identify it looks like waiting from the outside, but it is decoding frames the whole time. Spreading that across cores helps, and it will not transform anything, because much of it was already running outside the runtime lock before 2.5.
Which is why raising settings.scheduler.blocking_tasks is rarely the answer. If your slow tasks are computing rather than waiting, more of them at once buys no throughput and takes cores your streaming threads need. The symptom is catchup warnings while something else is busy, and the fix is usually fewer concurrent tasks rather than more.
For media work, the question is what else is on the clock. A clock runs its outputs one after another. Several encoders on one clock take turns on a single thread, however many cores sit idle.
If you run one demanding stream, let the encoder thread itself. That is the default, and it is what turns one busy core into seven and buys you headroom.
If you run several streams, keep each one on its own clock. Independent streams get one each by default; streams share a clock when they share a source or are assigned to one together. Separate clocks were worth more than any encoder setting we tried, and once streams have them the encoder setting stops mattering. Separate processes get you there too, at two to three times the memory, so reach for processes when you want the isolation rather than the speed.
Leave settings.ffmpeg.scaling_threads alone unless you are scaling heavily and have measured a reason.
Two numbers tell you where you stand. Catchup warnings in the log are the verdict: either the loop is keeping up or it is not.
Bracketing an output with on_output gives you the duty cycle, the share of each frame you are actually spending. A stream at 30% duty has room to grow. One at 90% is close to falling behind, even though both look identically healthy from outside.
Your machine is not this one. It has a different core count, possibly a different mix of core types, different memory, and it is probably running more than one thing. Your script is not this one either. Ours decodes and encodes and does nothing else, while yours may composite, scale, run several outputs off one source, or share the box with twenty other stations.
So measure it. Everything here came from a handful of scripts and the numbers liquidsoap already reports, and if you find a balance that differs from ours we would like to hear about it. That is more useful to us than agreement.